Table of Contents

The second quarter of 2023 proved to be a crucial period for BNB Chain, a public, open-source blockchain striving to deliver scalable smart contract support for decentralized applications.
With a focus on modular design and scaling solutions, BNB Chain continued to make significant strides in its ecosystem development, despite facing challenges from regulatory actions and increased competition. This blog summarizes the key highlights on the recent Messari’s Q2 report on BNB Chain and complement their findings with recent on-chain data to update the community with BNB Chain’s activity.
The TLDR of Q2’s activity
We went through the report and summarized the key points to save you some time!
Network Performance and Growth Initiatives
As highlighted in Messari’s report, BNB Chain experienced impressive growth in daily average active addresses and transactions, driven by increased activity from LayerZero. The rise in user engagement showcases the platform’s appeal to developers and users alike. Moreover, the introduction of initiatives like the Gas Grant Program and the Zero2Hero Incubator further exemplified BNB Chain’s commitment to investing in its ecosystem.
DeFi Resurgence and Stablecoin Landscape
The resurgence of DeFi activity on LayerZero was a notable highlight of Q2 2023. PancakeSwap, Venus, Alpaca Finance, and PinkSale dominated the DeFi space on BNB Chain, although PancakeSwap’s dominance decreased from the previous quarter. This shift signals a more diversified and robust DeFi ecosystem on the platform, reducing the risk of over-concentration.
Additionally, BNB Chain’s place in the stablecoin space remained substantial, with a total stablecoin market cap of approximately $5.7 billion, trailing behind Ethereum and TRON. However, the decline in BUSD’s market cap on BNB Chain due to regulatory actions resulted in USDT gaining dominance in the stablecoin landscape.
NFTs and Gaming on BNB Chain
Non-fungible tokens (NFTs) witnessed a rebound in secondary sales volume and the number of unique buyers and sellers. Several NFT marketplaces, such as zkBNB and Joepegs, experienced significant traction and contributed to the overall NFT ecosystem growth on BNB Chain. Our analysis also identified notable projects like Planet ZUUD and Tiny Tap, indicating a thriving NFT space on the platform.
Gaming on BNB Chain remained active, with top gaming applications like SecondLive witnessing a 100% increase in total unique active wallets. New game launches like Hippo Dash and Meta Merge also exhibited upward trends, indicating the growing appeal of gaming applications on BNB Chain.
Community and Developer Engagement
BNB Chain’s strong community growth was evident in various initiatives like the University Initiative and the Innovation Bootcamp. These programs not only attracted developers but also fostered a sense of ownership and participation among community members.
Looking ahead, BNB Chain’s roadmap includes initiatives to enhance scalability, further decentralize the network, and improve user access and experience. The platform aims to boost throughput by increasing the network’s gas limit, roll out a Rust-based BSC node client, and initiate state-offload to reduce data footprint. Additionally, integrating miner extractable value (MEV) into the network may further enhance its capabilities.
So what does on-chain data tell us about BNB Chain?
Using Nansen’s on-chain data, we took a closer look at the on-chain data to gain valuable insights into the growth and dynamics of the BNB Chain ecosystem during this period.
Daily Active Sender Addresses and User Engagement
Data source: Nansen
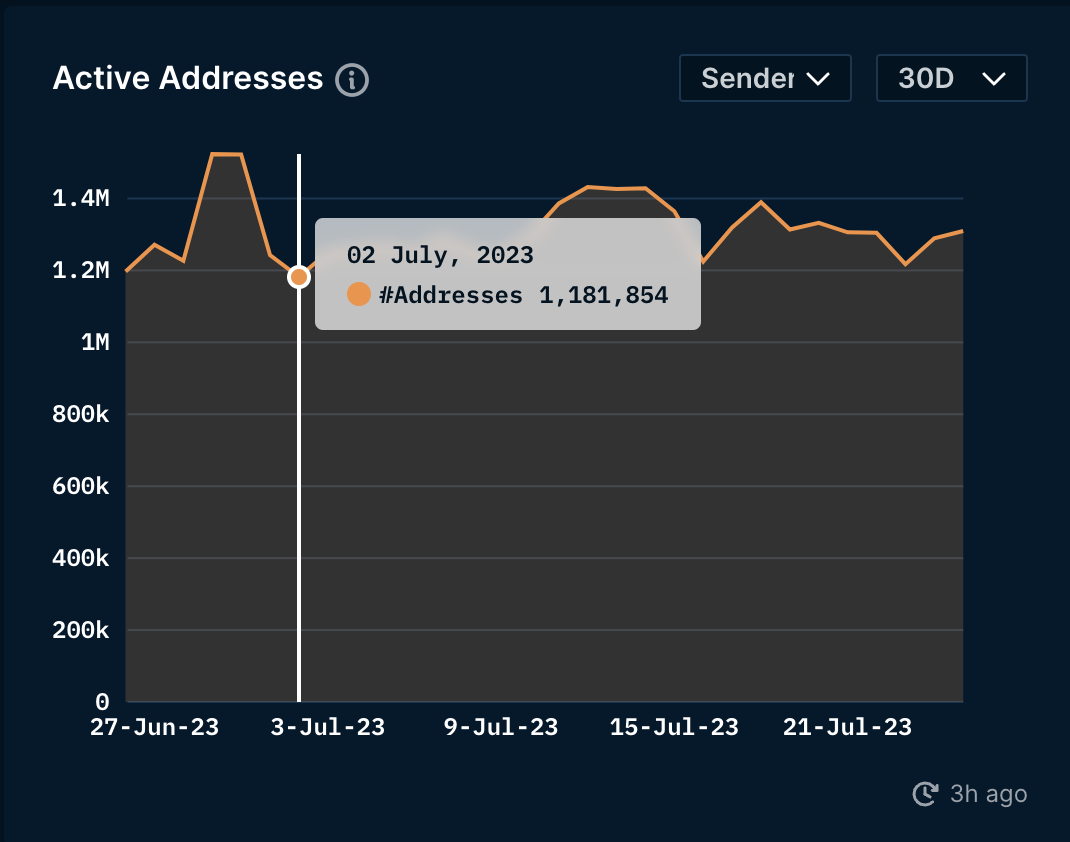
In the month of July, BNB Chain witnessed an impressive level of user engagement, with the minimum daily active sender addresses totaling around 1.18 million. These addresses represent users who executed transactions, including internal ones. Notably, this count only takes into account wallets that have sent at least one transaction.
However, what’s even more intriguing is that on its peak day, BNB Chain recorded a staggering 1.43 million daily active sender addresses. This indicates a significant surge in user activity and showcases the platform’s popularity and adoption during this period.
Moreover, over the course of July, approximately 30 million unique active addresses participated in transactions on the BNB Chain. This diverse and robust user base highlights the platform’s appeal to a wide range of users, from developers to everyday enthusiasts.
Gas Fees and Transaction Volume
Data source: Nansen
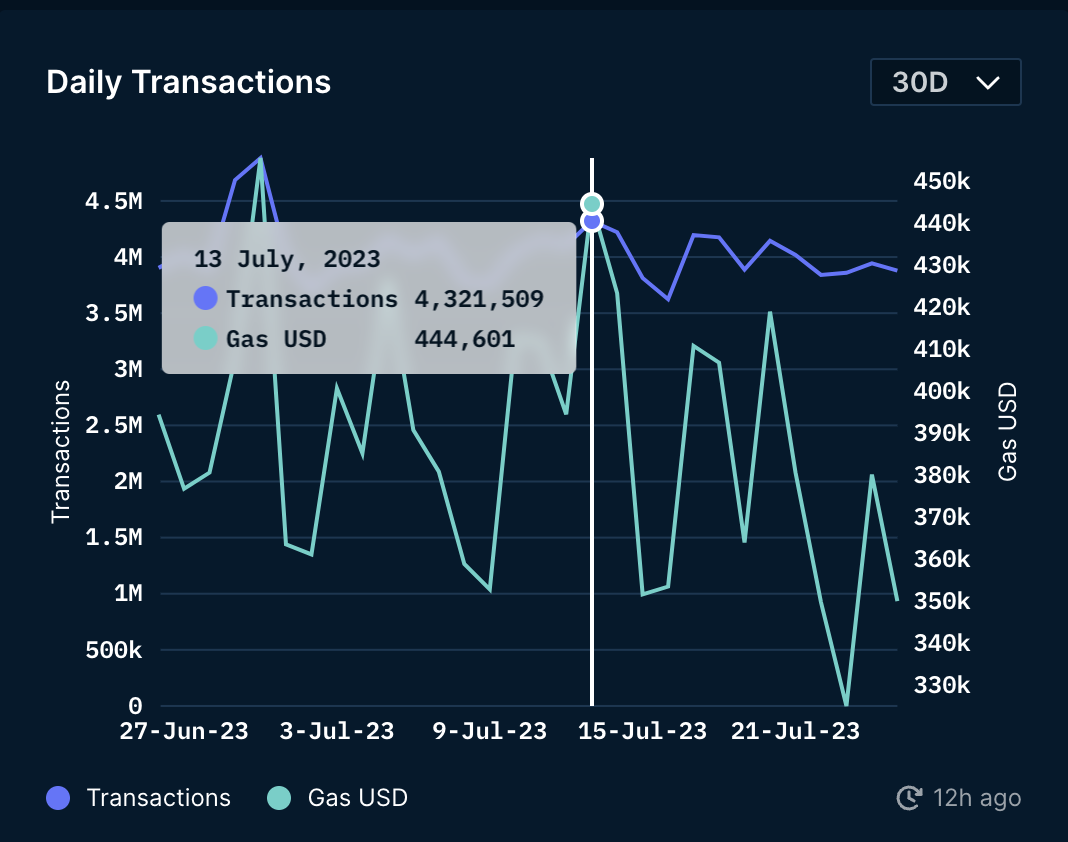
In terms of transaction volume, BNB Chain experienced a peak daily transactions count of 4.32 million on a single day in July. This substantial transaction volume indicates the platform’s ability to handle a large number of transactions efficiently.
Data source: Nansen
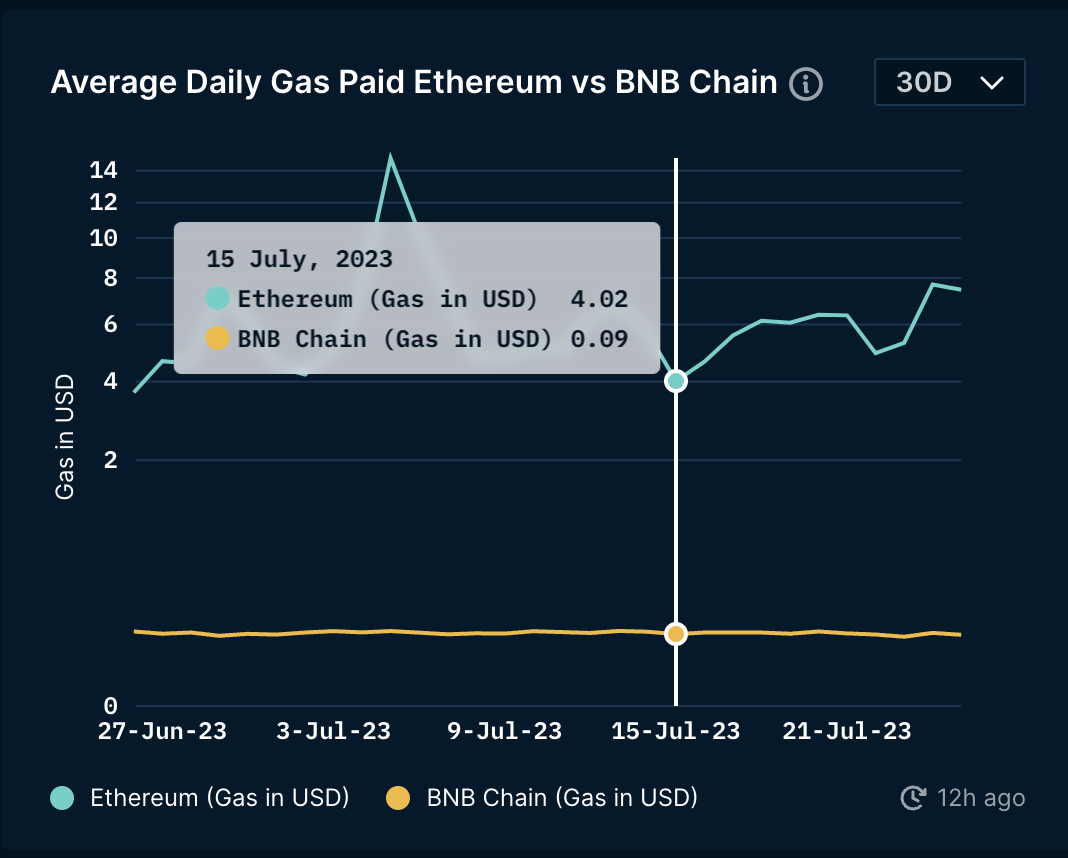
Interestingly, during the observed period, the daily average gas fees on BNB Chain remained stable, hovering between $0.09 and $0.1. This stability in gas fees is a positive sign for users, as it ensures a cost-effective environment for conducting transactions on the platform.
Contract Deployments and Ecosystem Growth
Data source: Nansen

July also saw a slight increase in the number of contracts deployed on the BNB Chain, as compared to the previous month of June. This rise in contract deployments showcases the growing interest from developers and projects in utilizing the platform to build decentralized applications (DApps) and smart contracts.
Top Entities and User Changes
Data source: Nansen
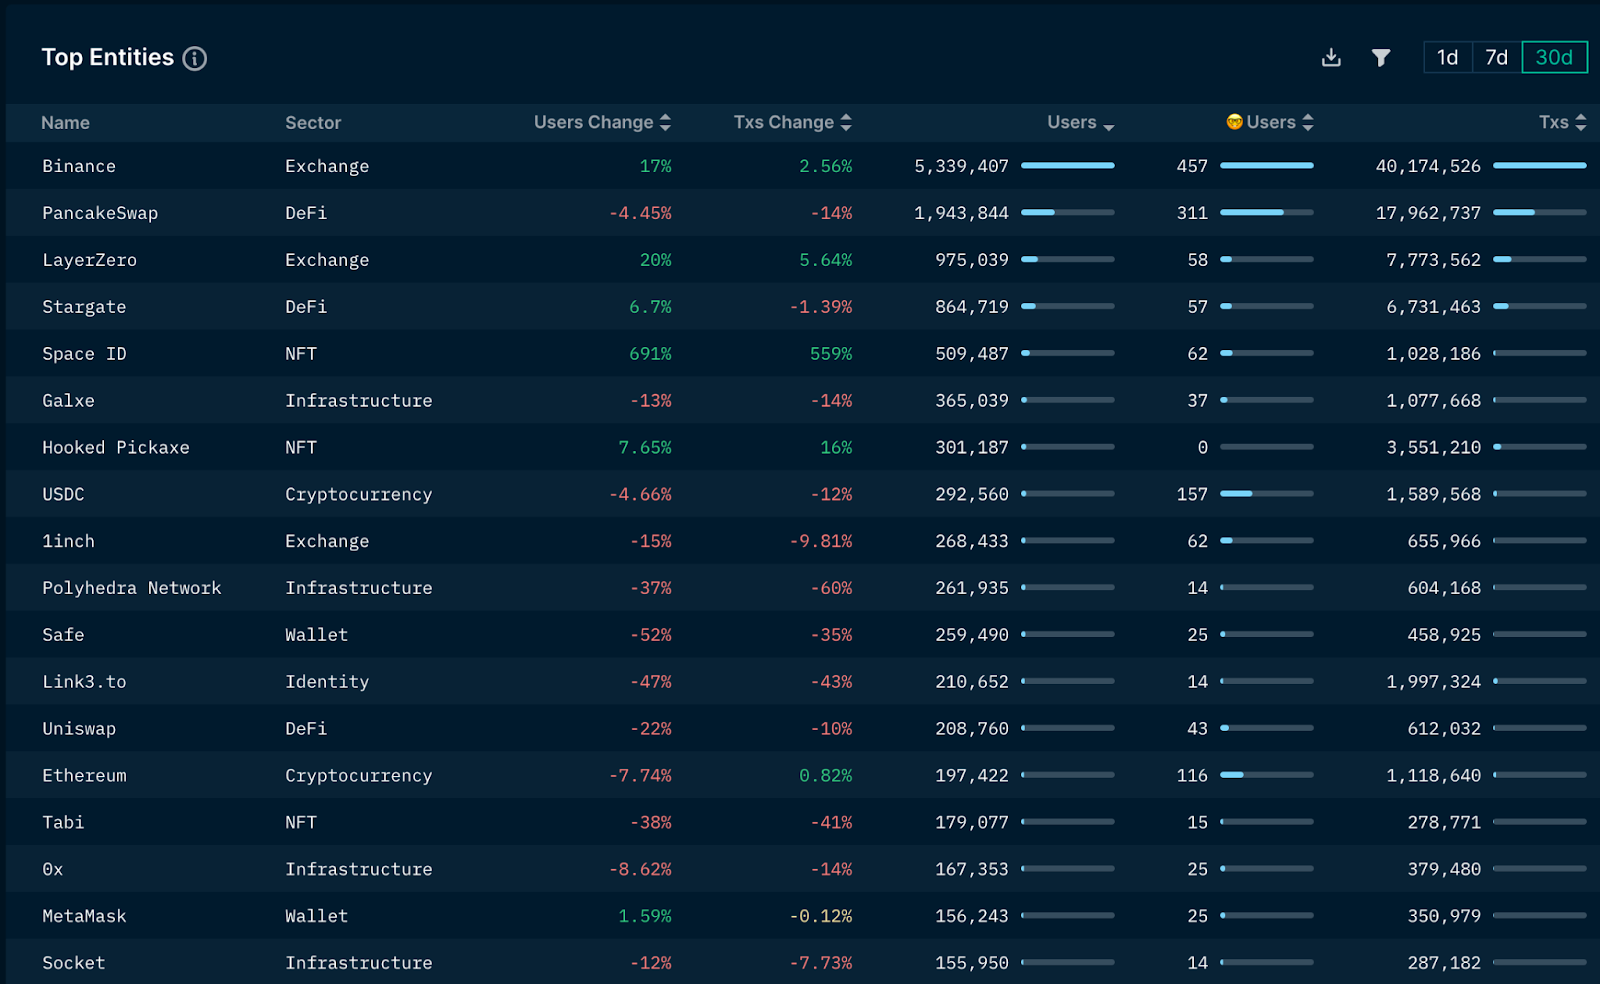
Taking a closer look at the top entities with the most significant changes in users, we find familiar names dominating the list. Binance Exchange, PancakeSwap, LayerZero, Stargate, Space ID, Galxe, Hooked, USDC, 1inch, and Polyhedra Network emerged as the top 10 entities with notable user changes during this period.
In contrast, the top 10 entities with the sharpest increase in user change brought some fresh faces into the limelight. TCP Global, CyberConnect, SpaceID, Beefy Finance, Lifeform, Element Market, Hashflow, Zillion, Odos, and Omisea experienced significant growth in user adoption, reflecting the dynamic nature of the BNB Chain ecosystem.
BNB Chain’s Cross-Chain Transactions
Data source: Nansen

Beyond its native ecosystem, BNB Chain showcased its interoperability by recording cross-chain transactions. According to data from Nansen, at the time of writing, approximately 9.62% of BNB Chain addresses participated in transactions on Ethereum, while around 6.67% of Ethereum addresses were involved in transactions on the BNB Chain. This cross-chain activity underscores the increasing importance of blockchain interoperability in the wider crypto landscape.
Smart Money on BNB Chain
Data source: Nansen
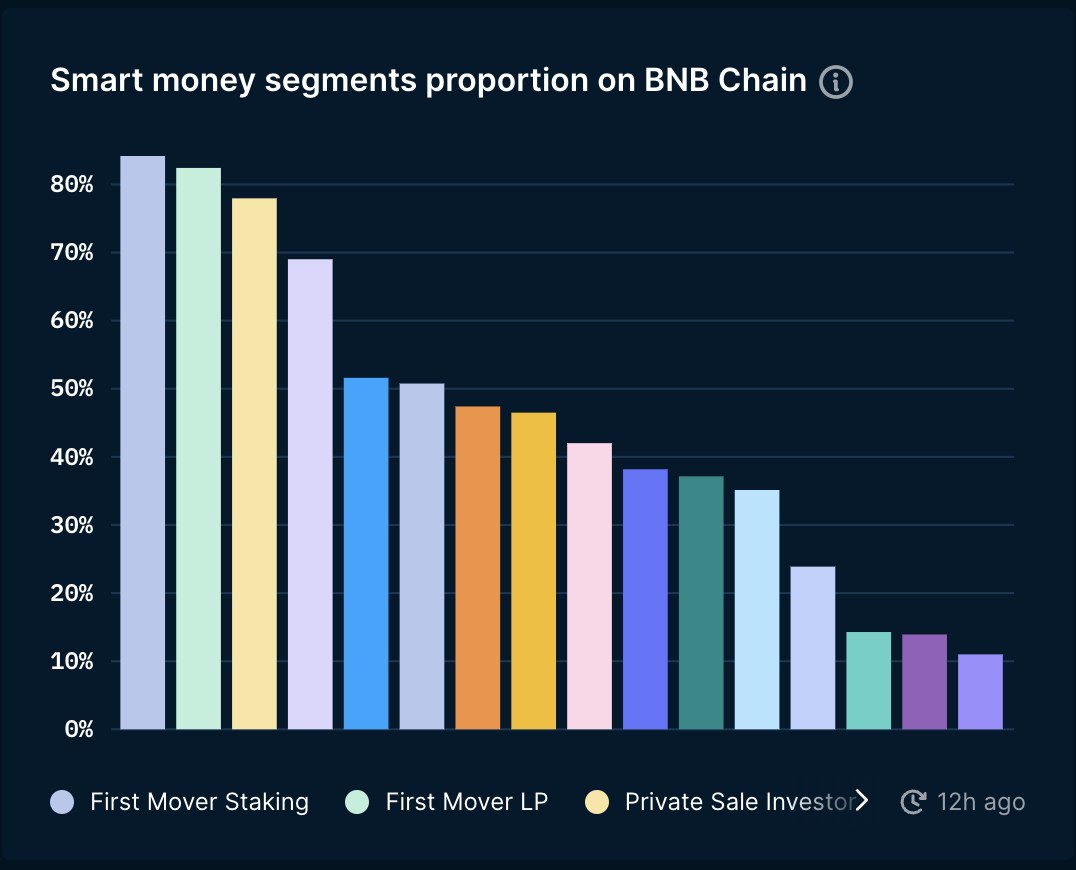
Using Nansen’s Smart Money label, we uncovered interesting trends among Smart Money Wallets on BNB Chain. These wallets are primarily engaged in first-mover staking, participating in liquidity pools (LP), or are private sale investors. Their strategic involvement highlights the importance of early movers and informed investors in shaping the direction of the BNB Chain ecosystem.
Conclusion
Q2 2023 proved to be a pivotal period for BNB Chain, witnessing substantial growth in network performance. With a focus on scalability, decentralization, and user experience, BNB Chain remains competitive. The month of July 2023 also proved to be an exciting and eventful period for BNB Chain. With stable gas fees, and increasing contract deployments, the platform demonstrated its ability to sustain growth and cater to a diverse community of users and developers.
As BNB Chain continues to navigate the ever-changing crypto landscape, these insights into on-chain data offer valuable guidance and understanding of its strengths and challenges.


